ComfyUI Node: Plot Images
PlotImages
CategoryezXY/image
apesplat (Account age: 1540days) Extension
ezXY scripts and nodes Latest Updated
2024-09-04 Github Stars
0.03K
How to Install ezXY scripts and nodes
Install this extension via the ComfyUI Manager by searching for ezXY scripts and nodes- 1. Click the Manager button in the main menu
- 2. Select Custom Nodes Manager button
- 3. Enter ezXY scripts and nodes in the search bar
Visit ComfyUI Online for ready-to-use ComfyUI environment
- Free trial available
- 16GB VRAM to 80GB VRAM GPU machines
- 400+ preloaded models/nodes
- Freedom to upload custom models/nodes
- 200+ ready-to-run workflows
- 100% private workspace with up to 200GB storage
- Dedicated Support
Plot Images Description
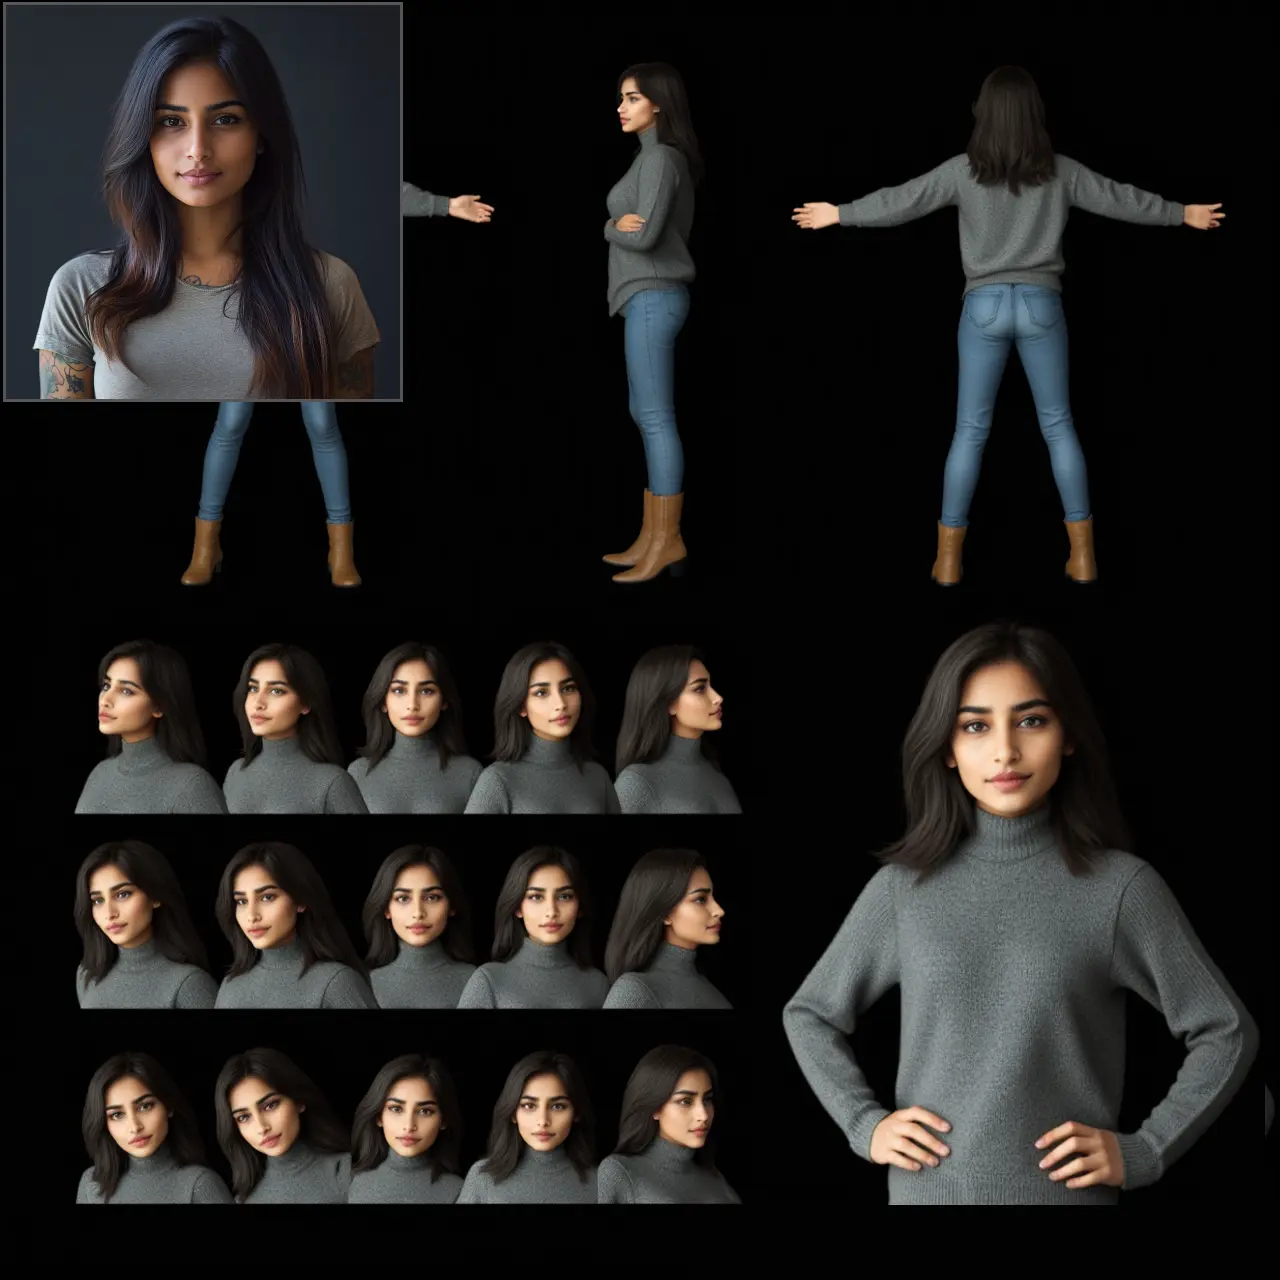
Create composite images by arranging multiple images in a grid format for clear and organized presentation.
Plot Images:
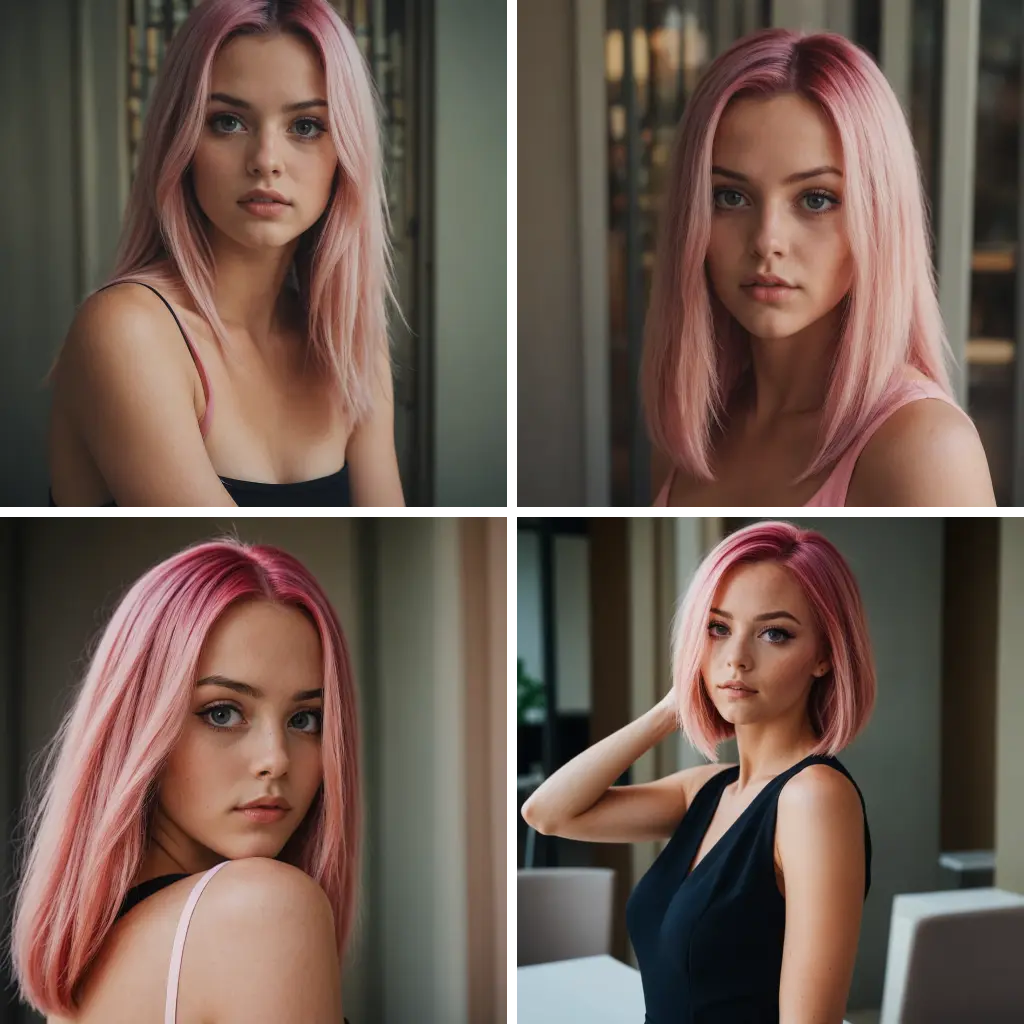
The PlotImages node is designed to help you create a composite image by arranging multiple images in a grid format. This node is particularly useful for visualizing a series of images in a structured manner, making it easier to compare and analyze them side by side. By specifying the positions of each image within the grid, you can control the layout and ensure that the final composite image meets your specific requirements. This node is ideal for tasks that require a clear and organized presentation of multiple images, such as creating image galleries, visual reports, or comparison charts.
Plot Images Input Parameters:
images
This parameter takes a list of images that you want to arrange in a grid. Each image should be in a compatible format and size to ensure a seamless composition. The images are the primary content that will be plotted in the grid.
x_pos
This parameter specifies the x-coordinates (horizontal positions) for each image in the grid. If the number of x-coordinates provided is less than the number of images, the last x-coordinate will be repeated to fill the remaining positions. This allows you to control the horizontal placement of each image within the grid.
y_pos
This parameter specifies the y-coordinates (vertical positions) for each image in the grid. Similar to x_pos, if the number of y-coordinates provided is less than the number of images, the last y-coordinate will be repeated. This allows you to control the vertical placement of each image within the grid.
force_all
This boolean parameter determines whether all dimensions should be padded before concatenation. If set to True, both dimensions will be padded, ensuring that all images fit within the grid. If set to False, only the necessary dimensions will be padded. The default value is False.
Plot Images Output Parameters:
plot
The output is a single composite image that combines all the input images arranged according to the specified x and y positions. This composite image is returned as a tensor, which can be further processed or saved as needed. The final image provides a clear and organized visualization of the input images in a grid format.
Plot Images Usage Tips:
- Ensure that all input images are of the same size or use the padding options to make them uniform.
- Use the
x_posandy_posparameters to control the exact placement of each image within the grid for a customized layout. - If you have a large number of images, consider adjusting the
force_allparameter to manage padding and ensure all images fit within the grid.
Plot Images Common Errors and Solutions:
Labels/Images don't add up!
- Explanation: This error occurs when the number of images does not match the product of the number of x and y labels.
- Solution: Ensure that the number of images you provide matches the total number of grid positions defined by the x and y labels.
ezXY: Plotted image too large
- Explanation: This error occurs when the final composite image exceeds the maximum allowed pixel size.
- Solution: Reduce the number of images or adjust the size of the images to ensure the final composite image is within the allowed pixel size limit. You can also modify the
max_image_sizevalue in theconfig.yamlfile if necessary.
Plot Images Related Nodes
RunComfy is the premier ComfyUI platform, offering ComfyUI online environment and services, along with ComfyUI workflows featuring stunning visuals. RunComfy also provides AI Models, enabling artists to harness the latest AI tools to create incredible art.


